Building an IoT dashboard with NASA Open MCT

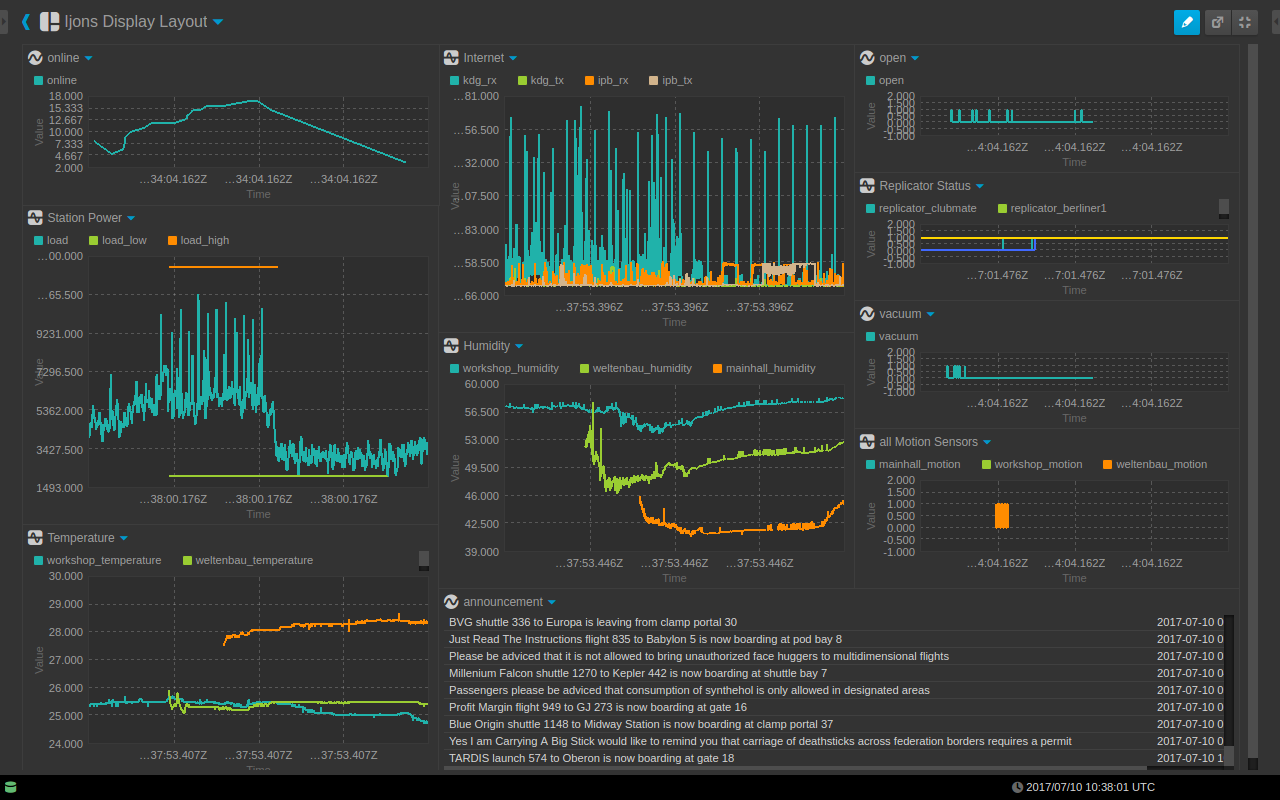
One important aspect of any Internet of Things setup is being able to collect and visualize data for analysis. Seeing trends in sensor readings over time can be useful for identifying problems, and for coming up with new ways to use the data.
We wanted an easy solution for this for the c-base IoT setup. Since the c-base backstory is that of a crashed space station, using space technology for this made sense.
NASA Open MCT is a framework for building web-based mission control tools and dashboards that they’ve released as open source. It is intended for bringing together tools and both historical and real-time data, as can be seen in their Mars Science Laboratory dashboard demo.
c-beam telemetry server
As a dashboard framework, Open MCT doesn’t really come with batteries included. You get a bunch of widgets and library functionality, but out of the box there is no integration with data sources.
However, they do provide a tutorial project for integrating data sources. We started with that, and built the cbeam-telemetry-server project which gives a very easy way to integrate Open MCT with an existing IoT setup.
With the c-beam telemetry server we combine Open MCT with the InfluxDB timeseries database and the MQTT messaging bus. This gives a “turnkey” setup for persisting and visualizing IoT information.
Getting started
The first step is to install the c-beam telemetry server. If you want to do a manual setup, first install a MQTT broker, InfluxDB and Node.js. Optionally you can also install CouchDB for sharing custom dashboard layouts between users.
Then just clone the c-beam telemetry server repo:
$ git clone https://github.com/c-base/cbeam-telemetry-server.git
Install the dependencies and build Open MCT with:
$ npm install
Now you should be able to start the service with:
$ npm start
Running with Docker
There is also an easier way to get going: we provide pre-built Docker images of the c-beam telemetry server for both x86 and ARM.
There are also docker-compose configuration files for both environments. To install and start the whole service with all its dependencies, grab the docker-compose.yml file (or the Raspberry Pi 3 version) and start with:
$ docker-compose up -d
We’re building these images as part of our continuous integration pipeline (ARM build with this recipe), so they should always be reasonably up-to-date.
Configuring your data
The next step is to create a JavaScript configuration file for your Open MCT. This is where you need to provide a “dictionary” listing all data you want your dashboard to track.
Data sets are configured like the following (configuring a temperature reading tracked for the 2nd floor):
var floor2 = new app.Dictionary('2nd floor', 'floor2');
floor2.addMeasurement('temperature', 'floor2_temperature', [
  {
    units: 'degrees',
    format: 'float'
  }
], {
  topic: 'bitraf/temperature/1'
});
You can have multiple dictionaries in the same Open MCT installation, allowing you to group related data sets. Each measurement needs to have a name and a unit.
Getting data in
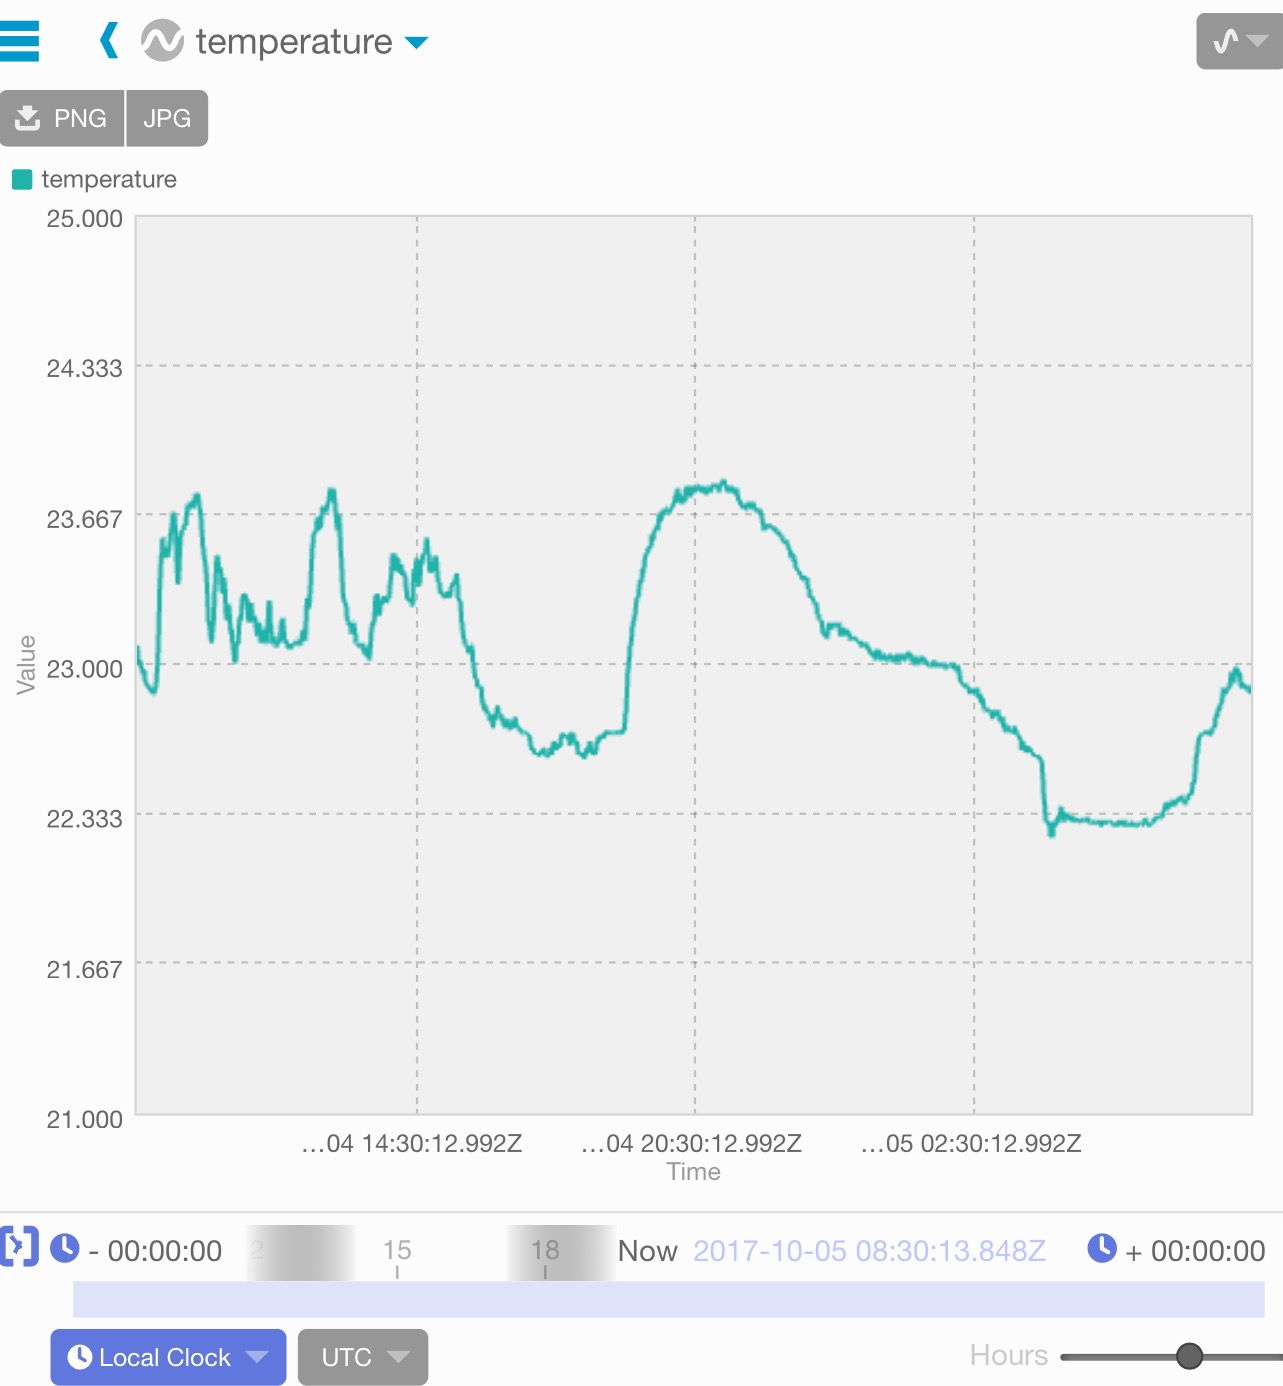
In the example above we also supply a MQTT topic to read the measurement from. Now sending data to the dashboard is as easy as writing numbers to that MQTT topic. On command-line that would be done with:
$ mosquitto_pub -t bitraf/temperature/1 -m 27.3
If you were running the telemetry server when you sent that message, you should’ve seen it appear in the appropriate dashboard.
There are MQTT libraries available for most programming languages, making it easy to connect existing systems with this dashboard.
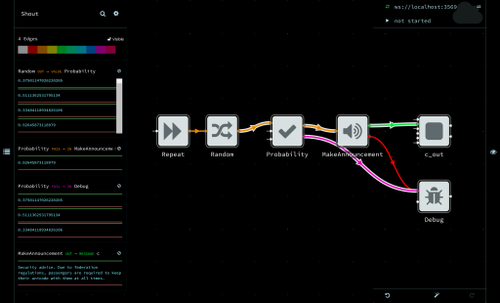
The telemetry server is also compatible with our MsgFlo framework, meaning that you can also configure the connections between your data sources and Open MCT visually in Flowhub.
This makes it possible to utilize the existing MsgFlo libraries for implementing data sources. For example, with msgflo-arduino you can transmit sensor data from Tiva-C or NodeMcu microcontrollers to the dashboard.
Status and how you can help
The c-beam telemetry server is currently in production use in a couple of hackerspaces, and seems to run quite happily.
We’d love to get feedback from other deployments!
If you’d like to help with the project, here are couple of areas that would be great:
- Adding tests to the project
- Implementing downsampling of historical data
- Figuring out ways to control IoT devices via the dashboard (so, to write to MQTT instead of just reading)
Please file issues or make pull requests to the repository.
Continue reading
NoFlo Kickstarter, the hacker's perspective