Thinking about the flow-based programming user interface

As readers of this blog already know, I’ve been working on the NoFlo flow-based programming environment for JavaScript. Lately the development effort has received a large boost from both the EU-funded SmarcoS Project and client work, and so the question of a flow design UI has become even more urgent.

In nutshell, flow-based programming (FBP) is a paradigm where programs are built from components that have a set of defined input and output ports. These ports are then wired together to make a graph that defines the logic and the data flow.
Where we are now
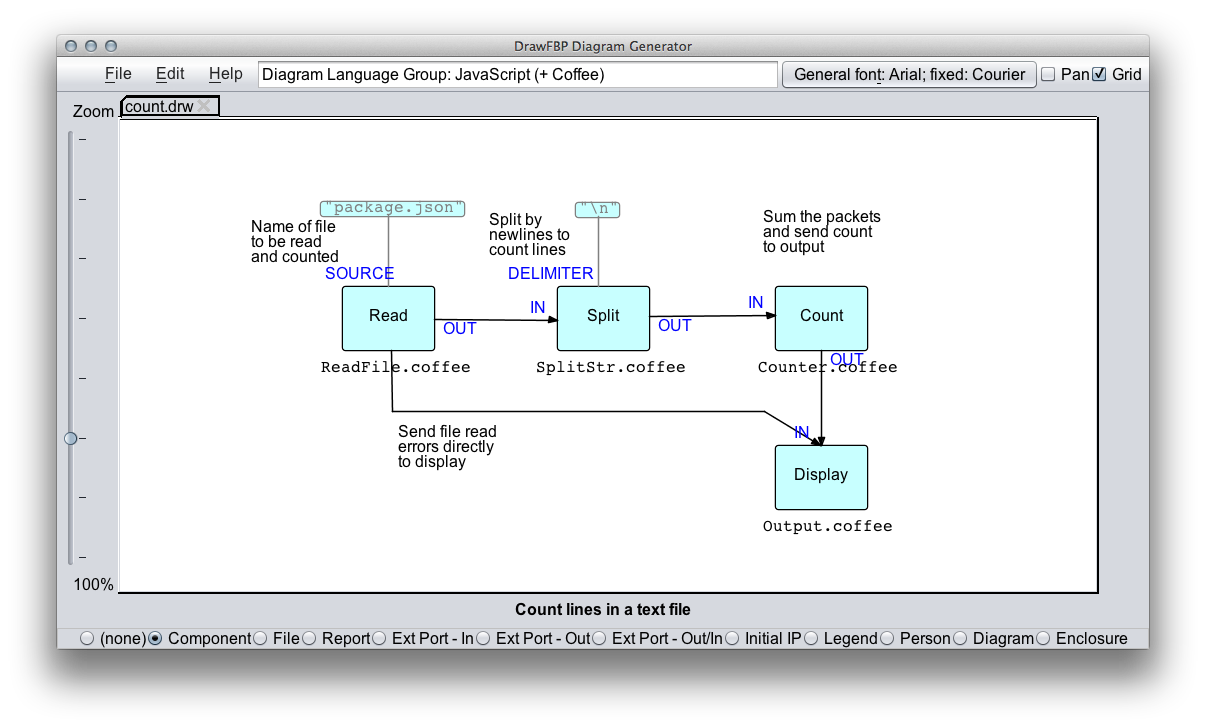
At the moment there are two user interfaces that can be used for defining NoFlo graphs visually. DrawFBP is a desktop application that can define flow-based program graphs for both NoFlo and the Java and C# flow runtimes.
This is the most functionally-complete FBP user interface, but is somewhat limited by Java’s cross-desktop capabilities and the inability to introspect the information available via NoFlo’s component loading interface. In any case, it is a great place to start exploring NoFlo development visually:
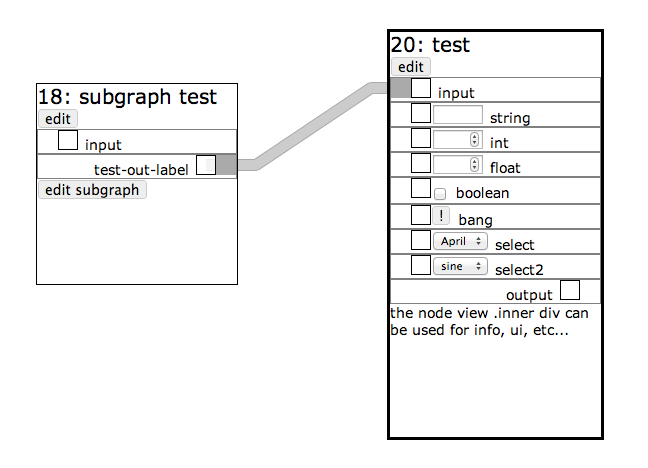
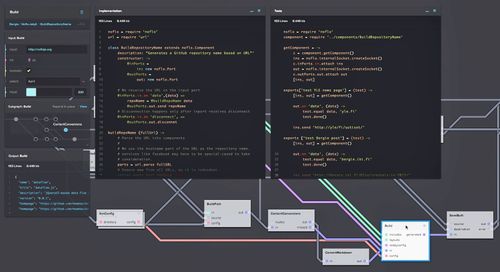
I’ve been working on a web-based user interface purpose-built for NoFlo called noflo-ui. Here input ports are on the left, and output ports on the right. Boxes depict ArrayPorts:
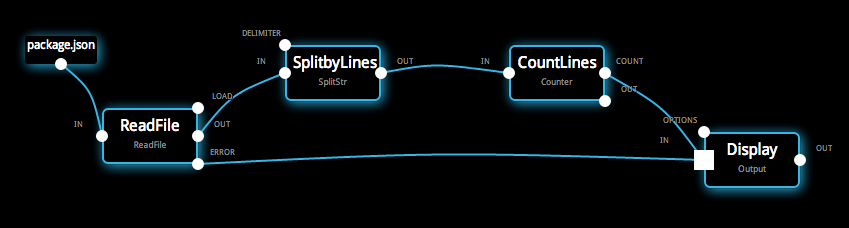
The noflo-ui interface benefits from being able to talk directly to NoFlo itself, and so getting all the metadata about components and their ports. The current iteration was built with the jsPlumb library, and works also on touchscreen devices. Imagine programming your NoFlo graphs on a tablet!
Visualizing written flows
While the user interface is missing, the typical way to visualize NoFlo graphs is using the .fbp domain-specific language. In that, the graph shown in the screenshots above would be written as:
# Read a file
'package.json' -> IN Read(ReadFile)
# Split the file contents by newlines
Read() OUT -> IN Split(SplitStr)
# Count the packets
Split() OUT -> IN Count(Counter)
# Send the total count to display
Count() COUNT -> IN Display(Output)

# Display also file read errors
Read() ERROR -> IN Display()
The noflo-graphviz tool can be used for generating visual graphs out of this syntax:
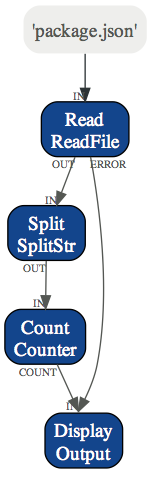
While in the real world you’d probably want to edit the graphs visually, at least the graphviz tool can be useful for autogenerating documentation for larger flow-based programs.
Potential collaboration
Flow-based programming is not a new idea, and there are many other implementations available, from programming languages like Go to purely browser-based environments. The dataflow library aims to provide a common web-based toolkit for managing flows in any FBP environment:
When the library matures a bit more, it is likely to be the basis for NoFlo’s graph editing interface.
Inspiration
The key part of making a user interface for NoFlo should be to make flow-based programs easier to make and to understand. As described in Bret Victor’s great Inviting on Principle talk, development tools could do a lot more to make the flow of the software and the different options and settings understandable:
Flow-based programming tools can help a lot here, as the main logic of a program is anyway depicted as a visual graph.
With NoFlo we can even connect the user interface to a already running piece of software, allowing users to see what is going on and to make changes while the application is runs. Think of the mimic boards in nuclear power plants where the operators can constantly see the status of every part of the process.

Visual identity
We’re building something new and exciting with NoFlo here, and so the visual identity should also reflect that. No need to follow the drab look-and-feel of traditional IDEs!
Consider this line from Tron: Legacy:
The grid. A digital frontier. I tried to picture clusters of information as they moved through the computer. What did they look like? Ships? Motorcycles? Were the circuits like freeways? I kept dreaming of a world I thought I’d never see. And then one day…

There is certainly something of flow-based programming right there. And this is why the current NoFlo UI has a distinct Tron-like look to it.
Another approach would be more organic, from how Alan Kay described object-oriented programming:
I thought of objects being like biological cells and/or individual computers on a network, only able to communicate with messages
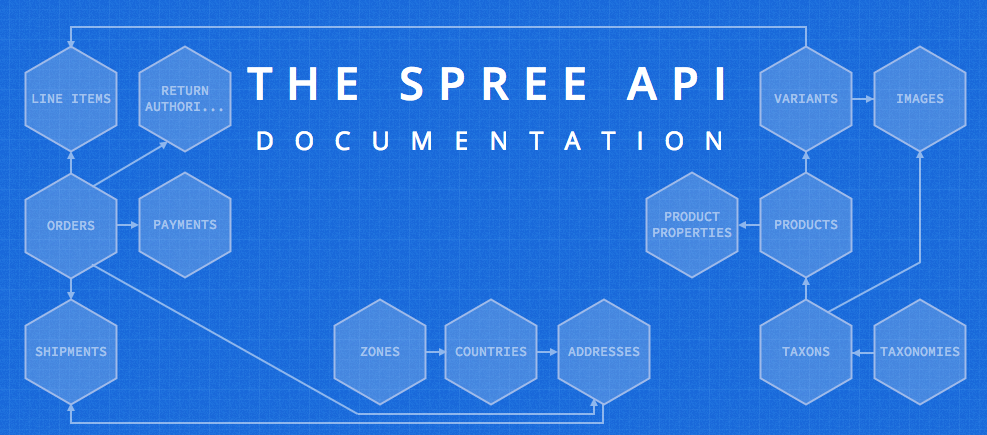
The honeycomb flow graph on the Spree API documentation also looks cool:
Prior art
Yahoo! Pipes is what most people bring up when I describe flow-based programming. They have a quite nice web-based UI:

Apple’s Quartz Composer is a very slick implementation of the same concept, but for the desktop:
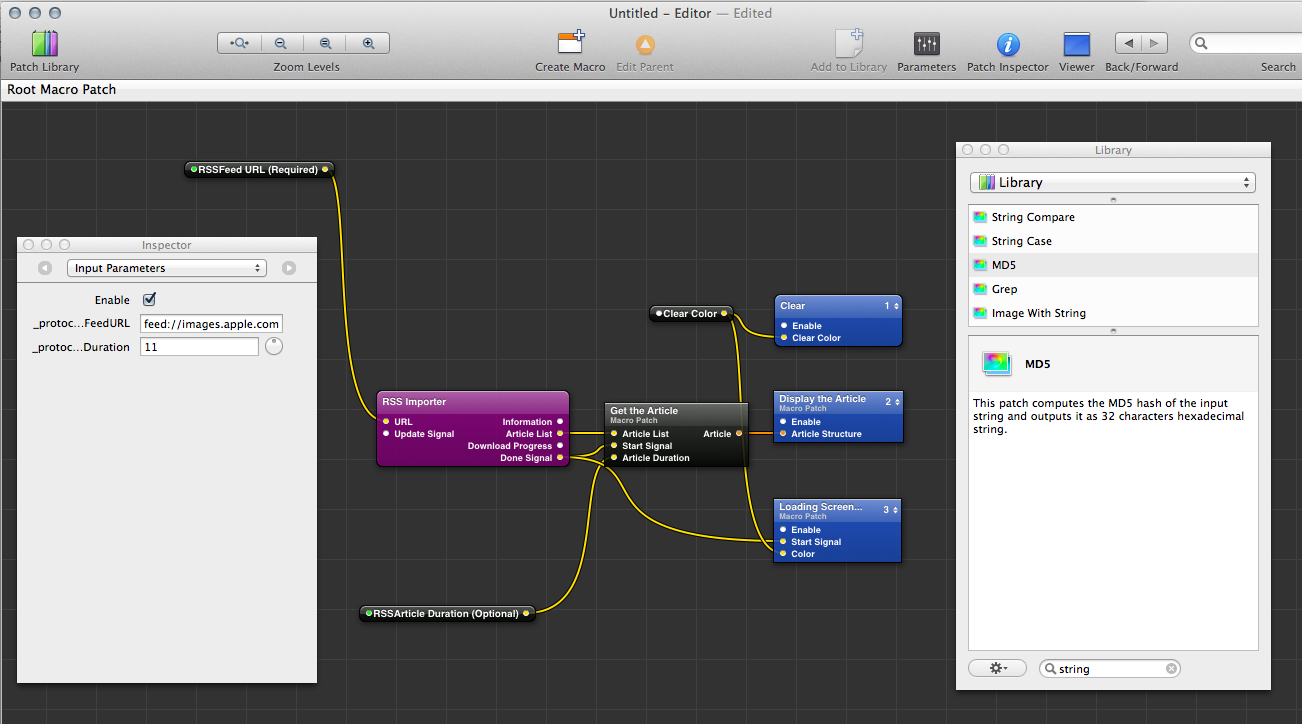
If Apple made a finger-friendly version of this for the iPad, we would be pretty close to the UI NoFlo needs to have.
The big picture
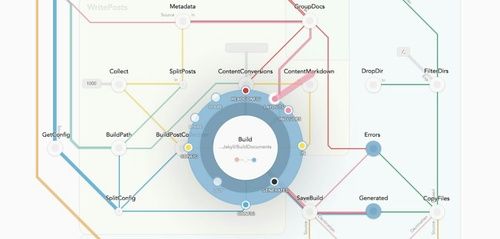
A problem with most of the existing flow-based editors is that they go into too much detail, making bigger graphs hard to decipher. Of course, moving chunks of a graph to subgraphs and using those as components helps, but still a complex program can be a confusing tangle of crisscrossing lines.
Luckily, there is an area of information design which has tackled this problem already: transit maps.
If you consider the transportation system of a big city as a flow-based program, it consists of a huge number of nodes and connections. And yet it is easy for people to figure out how to get around. Just look at this part of the Berlin subway map:
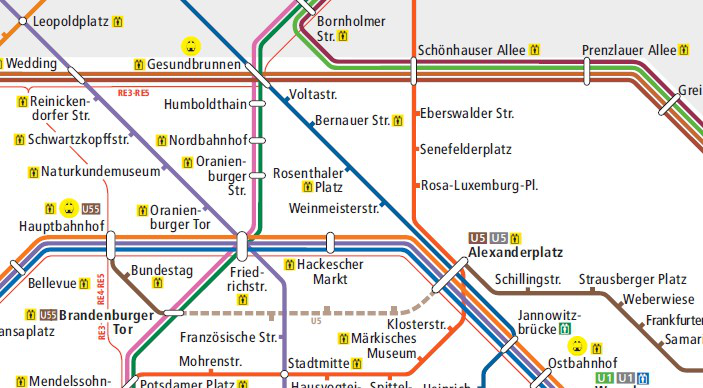
The different tariff zones even map quite nicely to the idea of subgraphs in FBP.
There are some key points here:
- Don’t focus on the details too much. You have nodes, and connections between them. Why show the port names on this level?
- Use color. Different flows in your program could be depicted as their own “subway lines”
- Nodes that are only connected to a single flow (for example, filters and converters) can be minimized, and more focus given to nodes where different flows interspect
NoFlo 0.3.1 will make it possible to annotate connections in a flow with arbitrary “route names” that can then be assigned to colors for visualization purposes.
Quite some research and tools already exist for automatic generation of subway maps. Maybe some of these could be repurposed to give the NoFlo UI a “bird’s eye view” to your flow-based programs?
Moving forward
So, how to make this user interface happen? As mentioned, I’m building software with NoFlo on daily basis now, and so better tooling is certainly urgent. And not just for me, but for all the others interested in flow-based programming. In the recent project planning sessions I’ve allocated some time to this, and so I hope we can get somewhere with a more-or-less working user interface still during this winter.
There are many things to consider:
- Graph editing on both desktop computers and tablets
- Collaborative editing between multiple users, maybe via ShareJS
- Refactoring: moving parts of a graph to its own subgraph, or “blowing up” a subgraph back into the main graph
- Browsing the available components and graphs
- Seeing compatible port types when making a connection
- Writing new components and modifying existing, maybe with CodeMirror
- Running the NoFlo graph and seeing the packets passing through the different parts
All of this will obviously take a lot of time, but we’ll have to see how far we get with the first iteration. Having an editor that people find more usable than writing graphs by hand should be the first goal.
If you’re interested in this, please follow the noflo-ui and dataflow repositories. The Flow-based programming mailing list is also a great place to discuss your ideas.
Update: this work eventually lead us to building Flowhub, a web-based IDE that works across all flow-based programming systems. Check it out!
Continue reading
NoFlo Kickstarter, the hacker's perspective