Business analytics with CouchDB and NoFlo

The purpose of business analytics is to find data from the company’s information systems that can be used to support decision making. What customers buy most? What do they do before a buying decision? What are the signs that a customer may be leaving?
For the last month we’ve been working in Salzburg to build such a system, the Intelligent Project Controlling Tool needed for running large collaborative research projects like IKS. Since the design we went with can be reused for other business analytics needs, I wanted to write a bit about it.
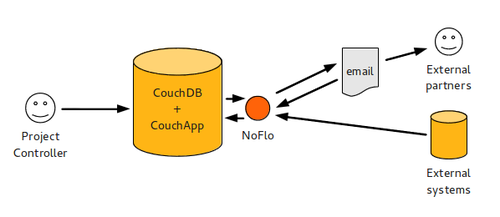
But first, here is how our system looks like:
Where does the data come from?
There are many ways to gather business data. Often the information systems already contain the data needed. But it may also be hidden in a jungle of spreadsheets. Or maybe some data is simply not available, and has to be filled in manually.
Handling all these cases in one system is a tricky question. To solve it, we went with a two-layered strategy:
- All data used for analytics is stored as Linked Data in a CouchDB system
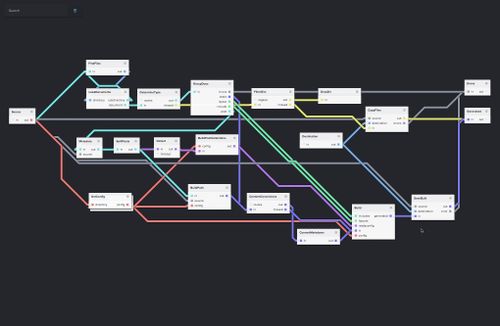
- NoFlo workflows are used for gathering data from the diverse sources and convert it to the format needed
In IKS’s case, much of the data was available in a series of spreadsheets. With these, we built the necessary workflows for first converting the spreadsheets into XML with Apache Tika, and then extracting the information from them in a sensible subset of JSON-LD.
Because IKS is a collaborative project, information needs to be gathered from a diverse group of partner organizations. Some of them have systems that provide the needed APIs (like Basecamp, which we use), and we can just periodically import the data. But with many we decided on a simple data interchange approach: spreadsheets handled over email.
In this approach, user files a data request into the system. This gets picked up by NoFlo, which sends an email with the appropriate spreadsheet template to the partner. Then it starts waiting for a reply. When a reply arrives, it extracts the data from the attached spreadsheet and imports it to the system.
Our NoFlo processes are mostly initiated by the CouchDB change notification API. We keep them running persistently using forever Node, so whenever some operation needs to be run it happens nearly immediately.
Ensuring data consistency
With any automation, and especially with the email-based data interchange, things can go wrong. Because of this we tag all data that we receive with its origin, whether it was some automated operation or an imported spreadsheet. These origins are called execution documents. Users can browse all completed workflow executions and see what data came in from them. These can then be either accepted or rejected.
This way if some partner accidentally sends faulty data, or something else breaks, the incorrect information received can be easily removed. CouchDB’s versioning capabilities help here.
Analyzing the data
CouchDB is built on top of the concept of map/reduce. Here you can modify and combine the data in lots of different ways using simple JavaScript functions. In our case we elected to write all our CouchDB code in CoffeeScript for simplicity. For example, here is the reduce function in CoffeeScript that counts totals of time planned, time used, and time left per task or partner in a project:
(keys, values, rereduce) ->
    roundNumber = (rnum, rlength) ->
        Math.round(parseFloat(rnum) * Math.pow(10, rlength)) / Math.pow(10, rlength)
    data =
        planned: 0.0
        spent: 0.0
        left: 0.0

    if rereduce
        for reducedData in values
            data.planned += reducedData.planned
            data.spent += reducedData.spent
        data.left = data.planned - data.spent
        return data

    for doc in values
        if doc['@type'] is 'effortallocation'
            data.planned += roundNumber doc.value, 1
        if doc['@type'] is 'effort'
            data.spent += roundNumber doc.value, 1
    data.left = roundNumber data.planned - data.spent, 1
    return data
If you figure out a new way to look at the data you have, simply write the needed map and reduce functions and save them into the database. CouchDB will then run them against existing data and produce numbers.
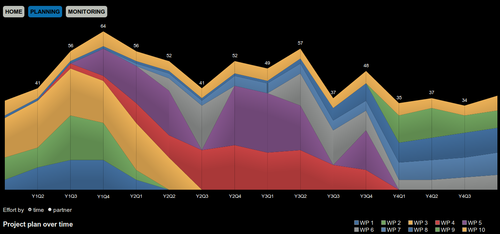
Data visualizations
Numbers are good, but to really see the information buried in them you need some visualizations. For this we decided to follow the CouchApp idea where the user interface code is stored in the database together with the data itself. This way no application servers are needed, and you can take the whole system with you just by replicating the database. Think of the possibility of doing some analysis on your company while flying to a meeting!
The visuals are in our case provided by JavaScript InfoVis Toolkit, a nice, MIT-licensed interactive graph library.
CouchDB views handle the number crunching, then CouchDB list functions process the numbers into the format needed for visualization. This leaves only a minimal amount of work for the client side.
For consistency our application has been built with CoffeeApp, so all the database and user interface code is in CoffeeScript.
In a nutshell
Any business analytics system dealing with moderate amounts of data can be built following this approach.
- Apache CouchDB is the central data store
- All data is stored as JSON-LD entities
- NoFlo handles all data imports
- Analytics based on the data are done with CouchDB map/reduce
- Visualization happens with a CouchApp using JavaScript InfoVis Toolkit
This way you have a business analytics environment that is easy to extend with more data when it becomes available. New analysis can be done by writing reasonably simple map/reduce functions, and CouchDB’s replication capabilities allow you to take the system and data with you.
Using JSON-LD for the data storage makes a lot of sense, as this way the relations between different pieces of information are easy to handle. And using URIs for data identifiers means you can easily mash up information coming from different sources together.
The two-layered approach of using NoFlo for data imports, and CouchDB for analysis also allows for clean separation of concerns. In our case, I did the workflow part of things, and Szaby built the visualizations.
Continue reading
Why did I reimplement Jekyll using NoFlo